California Nearly Sold Out! From Tariff Shock to Record Harvest: The Wild Ride of the 2025 Global Almond Trade!
In 2025 the Almond Industry Faces a Perfect Storm
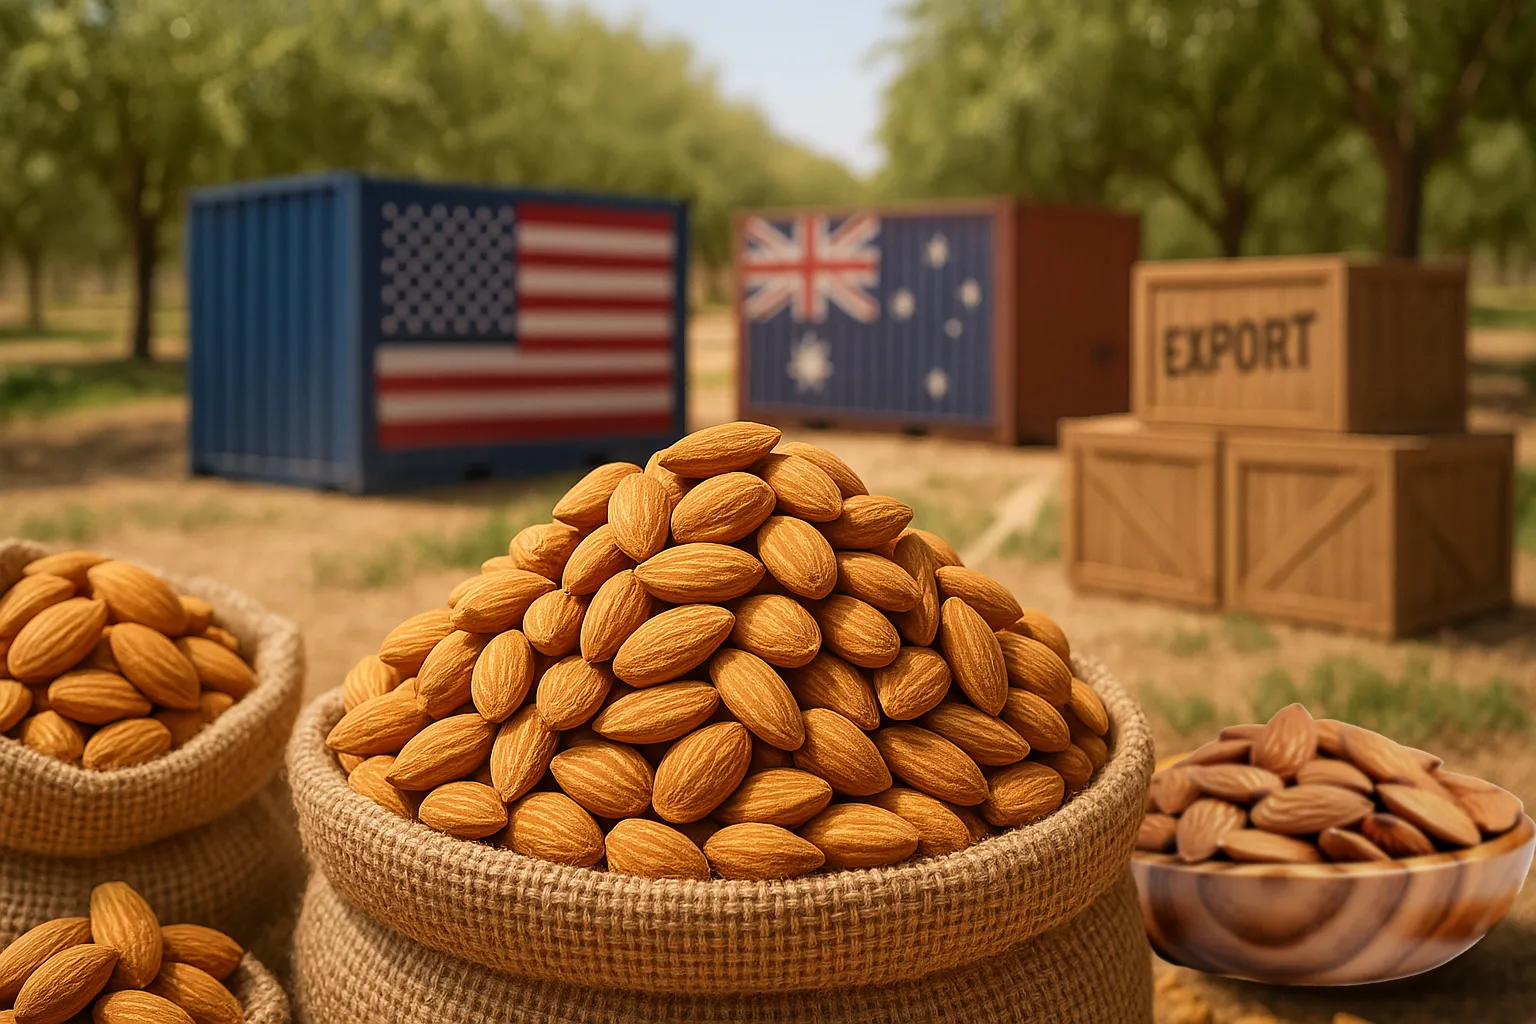
Global almond supply has surged 23 % to 1.79 million t just as a new wave of U.S., EU and Chinese tariffs rattles trade routes. California (80 % of world supply) is nearly sold out, Australia is shipping more than it produces, Spain’s orchards are water‑logged, and buyers everywhere are recalculating landed costs.
This report distils every key data point—shipments, production, tariffs, prices, weather and policy—into a single, easy‑to‑read guide for Momex traders and food professionals.
Latest Market Updates & News
1. Overview of Tariff & Trade Disruptions
In early 2025, the U.S. administration under President Donald Trump triggered major tariff measures:
- 1 February 2025: Executive orders imposed a 25 % tariff on imports from Canada and Mexico, with a special 10 % rate on Canadian energy.
- 3 February 2025: The U.S. announced a one‑month pause of these tariffs for Canada and Mexico, contingent upon stricter border‑enforcement efforts.
- 4 February 2025: A 10 % tariff on Chinese imports took effect.
- 4 March 2025: The 25 % tariffs on Canada and Mexico began, following the pause’s expiry.
Simultaneously, the U.S. introduced a baseline 10 % duty on all other imports on 2 April 2025, while 125 % remains in force on imports from China, prompting Beijing to retaliate with an 84 % tariff on U.S. almonds. President Trump also proposed a 24 % import tariff on India—although negotiations with India continue in hopes of reducing the current 42–120 % range on U.S. almonds.
Across the Atlantic, EU countermeasures arose after the White House slapped a 25 % tariff on European steel and aluminium (effective 12 March). In retaliation, the EU Commission planned similar levies on U.S. agricultural products, including almonds. A first round started 1 April (maintaining pre‑existing tariffs on products like U.S. peanut butter and dried cranberries). A second round was scheduled for mid‑April, and a further round, set for 1 December 2025, will specifically include shelled and inshell almonds at 25 %.
Canada and Mexico responded with up to 25 % reciprocal tariffs after 4 March 2025. Meanwhile, Vietnam faces 46 % reciprocal tariffs from the U.S., raising concerns about its export competitiveness in fruit and nuts.
Experts note that even if the U.S. government issues an aid package to farmers (as in 2018), smaller producers may still suffer due to uneven distribution of subsidies and persistent cost pressures.

2. U.S. Almond Exports: Key Facts & Figures
According to industry data, California accounts for almost 80 % of global almond supply and exports around 80 % of its production. The 2024/25 U.S. almond crop is pegged at about 2.7 billion lbs, 1 % lower than last year’s final receipts of 2.68 billion lbs, but still robust. By February, U.S. almond commitments had reached 577.4 million lbs, the highest in three months yet still 8.5 % off last year’s pace. New February sales of 221 million lbs were 3 % above last year, setting a new monthly record.
- March 2025 shipments: 221 million lbs (7 % below March 2024). Exports 170 mln (‑3 %), domestic 52 mln (‑17 %).
- Year to date (Aug–Mar 2024/25): 1.344 billion lbs exported (‑0.9 %), 465.54 million lbs domestic (‑3.5 %), and 1.809 billion total (‑1.6 %).
Country‑by‑Country (Aug–Mar)
- India: 261 mln lbs (‑9.4 %).
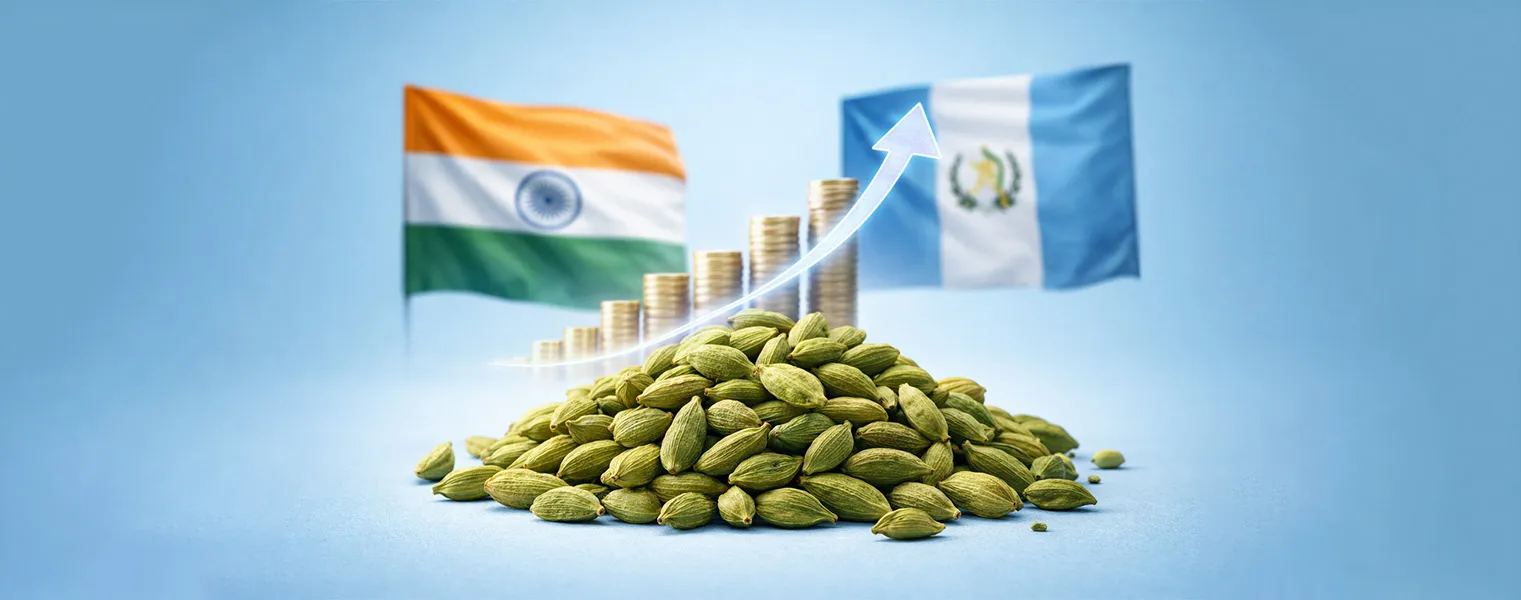
Negotiations with the U.S. might reduce tariffs, currently at 42–120 %, a move that could “significantly alter market dynamics.”
- Spain: 110 mln lbs (‑18.1 %). A combination of Spanish local production gains and looming 25 % EU tariffs on U.S. almonds complicates trade.
- UAE: 107.58 mln lbs (‑2.8 %), though Middle East shipments as a region are up, thanks to Turkey’s surge.
- Netherlands: 94.4 mln lbs (+23.9 %).
- Turkey: 81.44 mln lbs (+35.4 %).
- Italy: 63.13 mln lbs (+5.8 %).
- Germany: 60.76 mln lbs (‑21.5 %).
- Japan: 59.64 mln lbs (+4.3 %).
- Morocco: 46.60 mln lbs (+10.1 %).
- China/Hong Kong: 44.20 mln lbs (‑48.6 %).
China was once a top destination but has dropped after retaliatory tariffs (84 %) and competition from Australian almonds.
Exports to Canada grew 12.3 % over the past few years (to around 37.79 million lbs in the current season), while Mexico also increasingly relies on U.S. supply, though both countries introduced reciprocal tariffs. In practice, U.S. origin remains dominant because alternative sourcing is negligible.

3. Global Production Up 23 %; Mixed Bloom in California
As reported by the International Nut and Dried Fruit Council (INC), global almond production in 2024/25 hit 1.794 million metric tonnes (kernel basis), a 22.5 % gain from prior seasons:
- USA: 1,245,780 t, +14.6 %. Reservoirs are ~96 % full statewide (70 % in southern areas). However, 2025/26 bloom was hampered by poor bee health, making a bumper crop “unlikely.”
- Australia: 153,550 t, +38.7 %. Exports for 2024/25 soared 29.4 % to 169,541 t, surpassing production for the second year. A 2017 free trade agreement with China continues to boost sales, and shipments to India have also grown. 2025 production is put at 155,550 t, a 5.5 % dip from last year’s record. Prospects remain strong out to 2027/28 (176,700 t) if weather cooperates.
- Spain: 122,300 t, +8.1 %. March was the wettest since the 1960s. Excess moisture aids reservoirs (now ~70 % full) but raises disease risks. Southeastern Spain lags at 20 %. Organic growers hope for tariffs to level the playing field with cheaper U.S. imports.
- Turkey: 30,000 t, +20 %.
- Portugal: 25,000 t, +19.9 %.
- Italy: 21,000 t, −3.7 %.
- Chile: 9,583 t, −23 %.
- China: 16,780 t, +11.9 %.
- Morocco: 18,000 t, −2.7 %.
- (Others range from 6,000 t to 25,000 t.)

4. Australia’s All‑Time‑High Exports
February 2025 wrapped up the Australian almond marketing year (Mar–Feb) with total shipments at 169,541 t, up 29.4 %. Domestic shipments rose 6.6 % to 26,029 t, while exports jumped 34.6 % to 143,512 t.
- China: 76,121 t (+128.1 %), propelled by the 2017 free trade deal and recent shift away from U.S. origins.
- India: 19,803 t (+3.2 %).
- Turkey: 12,410 t (+12.5 %).
- Vietnam: 8,525 t (‑27.7 %).
- Spain: 3,611 t (‑65.6 %).
- Germany: 4,685 t (+24.4 %).
- UAE: 3,932 t (+66 %).
February alone saw 5,533 t shipped, including 3,129 t for export. Higher tariffs on U.S. almonds in multiple markets make Australian supplies more appealing, though final volumes hinge on actual orchard availability.

5. Spain’s Rainy March & Rebounding Exports
Spain’s wettest March since the 1960s came at a delicate bloom period. Pollination was hampered by damp orchards, raising concerns of pests and fungi. On the other hand, water shortages from last year’s drought have eased. Reservoirs now average 70 % capacity (20 % in some southeastern areas).
Despite uncertainties, Spanish almond exports from August 2024 to January 2025 climbed 23.1 % to 91,152 t (up from 74,029 t the prior season). Key buyers:
- France: 18,729 t (+10 %).
- Germany: 18,647 t (+22.5 %).
- Italy: 17,975 t (+43.5 %).
- Netherlands: 4,333 t (+75.5 %).
- Portugal: 3,362 t (‑6 %).
- UK: 2,159 t (‑20.2 %).
- Egypt: 1,865 t (+222.7 %).

6. Harvest Time, Quality & Price Trends
Harvest Calendars
- California: Aug–Oct (bloom Feb–Mar).
- Australia: Feb–Apr.
- Spain: Sep–Nov.

Current Spot Prices
- Iran inshell FOB: €1.55 /kg ▲ 1.31 %.
- U.S. kernels FAS: €2.40 /kg ▼ 0.84 %.
- Spanish kernels FOB: €5.70 /kg ▼ 1.21 %.
Forward Signals
- California crop 69 % sold/committed; tight carry‑out expected.
- USDA’s 20 May Subjective Estimate—a figure below 2.6 bn lbs could ignite a rally.
- EU processors budgeting €6.00 /kg landed for post‑December arrivals.

7. Tariff Impact & Global Trade Dynamics
- EU 25 % duty may push European buyers toward Spanish, Australian and Turkish kernels.
- China’s 84 % duty has already cut U.S. share by half; Australian almonds fill the gap.
- India’s possible duty relief could unleash 50–70 mln lbs of extra U.S. demand.
- Canada & Mexico likely stay with U.S. supply despite 25 % duty; proximity and quality trump cost.
8. Export & Import Trends
- U.S. to India: 261 mln lbs (‑9.4 %).
- U.S. to Netherlands: 94 mln lbs (+23.9 %).
- Australia to China: 76,121 t (+128 %).
- Spain to France: 18,729 t (+10 %).
EU importers complain tariffs will hurt processors, but Spain’s organic lobby wants them for fairer competition.

9. Market Analysis & Signals
- Tariff roulette keeps buyers cautious—shorter contracts, more origin diversification.
- Weather watch in California: bee health + heat stress = flat to lower 2025 crop.
- Currency & freight: Strong USD and Red‑Sea rerouting narrow Australia’s price advantage.
- Cross‑nut shifts: Chilean walnuts and Iranian pistachios gain share in China, hinting at similar almond substitution.
- Farmer aid could soften U.S. grower margins but won’t fix lost market share.
Price outlook: Steady‑to‑firm through Q3; bullish risk if India cuts duty or USDA estimate surprises low.
10. Additional & Complementary Updates Not Covered Above
- Gansu → Morocco: First Chinese Belt‑and‑Road almond shipment signals new niche suppliers.
- Vietnam 46 % tariff headline vs. 2.5 % actual for cashews—illustrates how tariff codes can mislead headline numbers; almond HS codes could face similar nuance.
- Tanzanian oversupply drove inshell prices from $2,050 to $1,350/t—a reminder of potential raw‑nut price swings that could spill into kernel markets.
- EU tariff timetable: 15 Apr (fruit juice), 16 May (industrial goods), 1 Dec (almonds, soy).
- U.S. PPI for almonds steady at 357.337 since Apr‑24—may dip only if Chinese demand collapses.
- Drone pollination trials in Madera County show 8 % yield lift—tech could offset bee shortages long‑term.
Conclusion
Record supply has not delivered cheap almonds. Instead, tariffs, tight carry‑out and weather risk keep prices elevated. Importers should diversify origins and lock in needs before the EU’s December duty kicks in, while exporters must court India, the Middle East and niche Belt‑and‑Road markets to offset lost Chinese volume.
FAQs
- Why are almond prices not falling despite record production?
Tariffs, strong demand and a nearly sold‑out U.S. crop keep supply tight.
- When will the next big price trigger arrive?
The USDA Subjective Estimate on 20 May and any India duty decision.
- Which countries benefit most from U.S.–China tensions?
Australia (exports +128 % to China) and Spain (EU home‑grown push).
- How big is Australia’s share of world production?
Roughly 10 %, second only to the U.S.
- What quality advantages does Spain offer?
Rising organic acreage and EU proximity; premiums for pesticide‑light kernels.
- Are Canada and Mexico really stuck with U.S. almonds?
Yes—98–100 % of their imports already come from the U.S.; alternatives are scarce.